Page Compiled By: Martin Melaugh
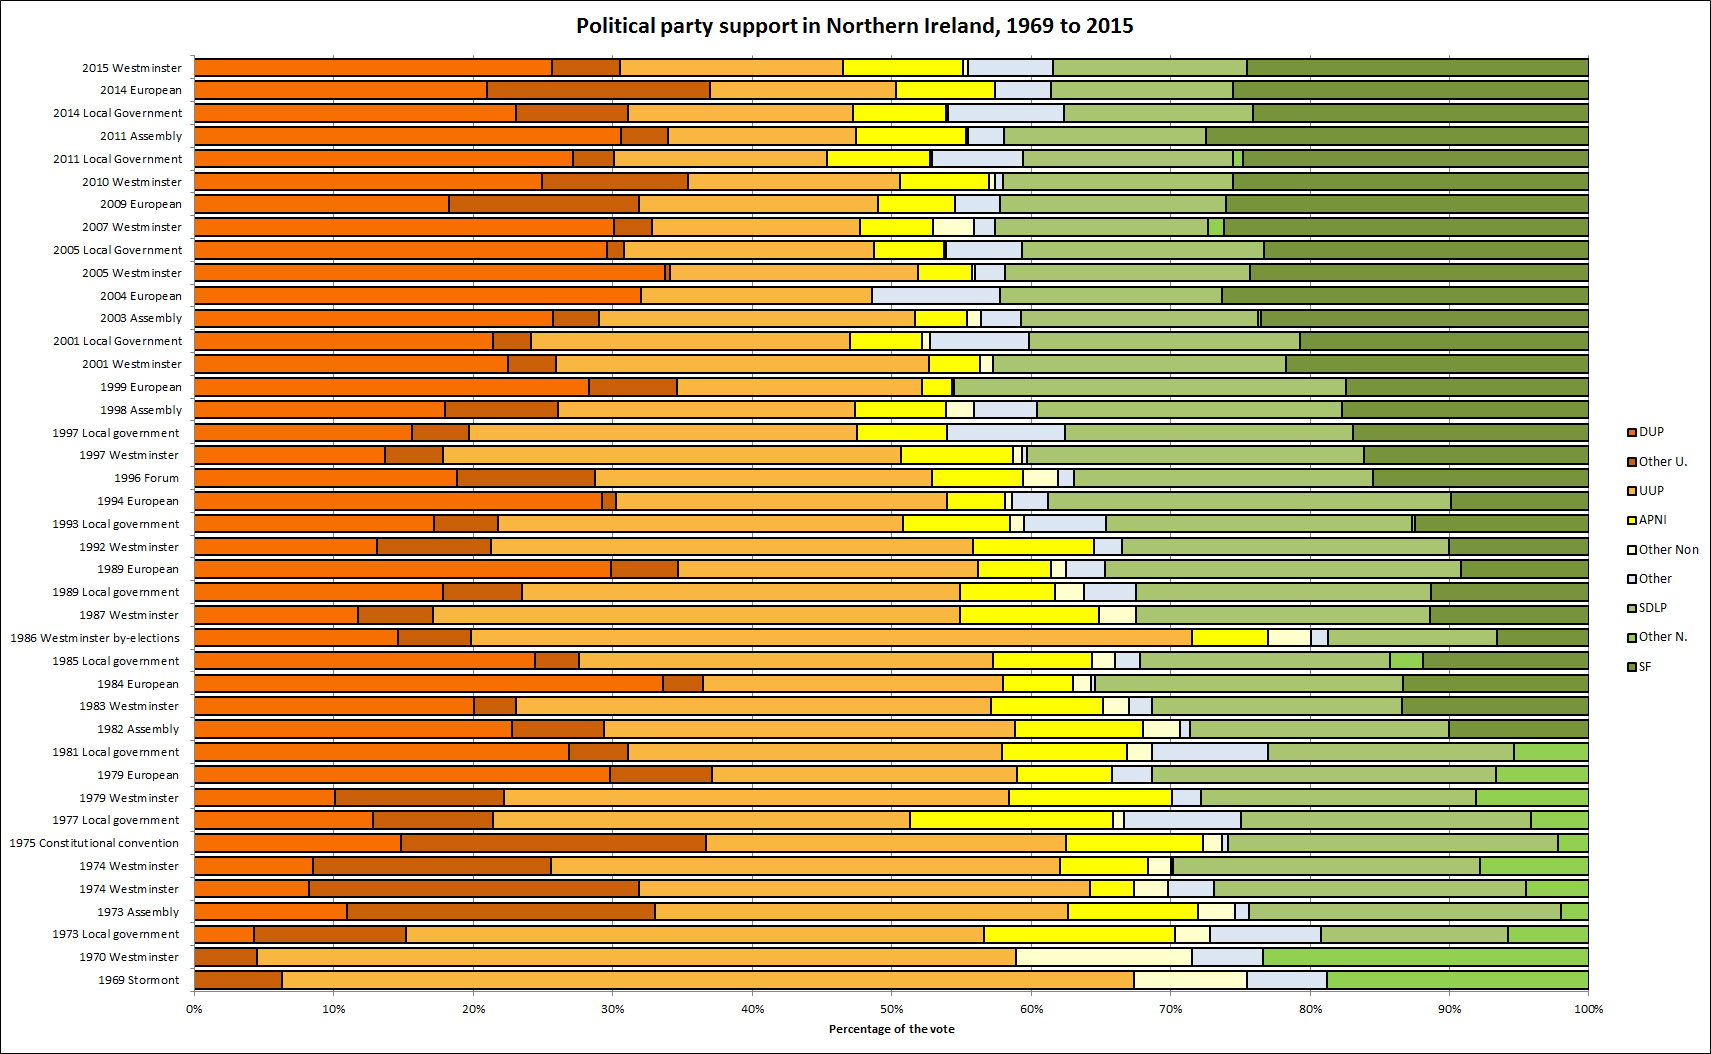
Election | Total Unionist | Total Nationalist | Unionist bloc | Nationalist bloc | Non confessional | Other | |||||
|
|
| UUP | DUP | Other U. | SDLP | SF | Other N. | APNI | Other Non |
|
1969 Stormont | 67.4 | 18.8 | 61.1 | - | 6.3 | - | - | 18.8 | - | 8.1 | 5.7 |
1970 Westminster | 58.8 | 23.3 | 54.3 | - | 4.5 | - | - | 23.3 | - | 12.6 | 5.1 |
1973 Local government | 56.6 | 19.2 | 41.4 | 4.3 | 10.9 | 13.4 | - | 5.8 | 13.7 | 2.5 | 8.0 |
1973 Assembly | 61.9 | 24.1 | 29.3 | 10.8 | 21.8 | 22.1 | - | 2.0 | 9.2 | 2.6 | 1.0 |
1974 Westminster | 64.2 | 26.9 | 32.3 | 8.2 | 23.7 | 22.4 | - | 4.5 | 3.2 | 2.4 | 3.3 |
1974 Westminster | 62.1 | 29.8 | 36.5 | 8.5 | 17.1 | 22.0 | - | 7.8 | 6.3 | 1.6 | 0.2 |
1975 Constitutional convention | 62.5 | 25.9 | 25.8 | 14.8 | 21.9 | 23.7 | - | 2.2 | 9.8 | 1.4 | 0.4 |
1977 Local government | 50.8 | 24.7 | 29.6 | 12.7 | 8.5 | 20.6 | - | 4.1 | 14.4 | 0.8 | 8.3 |
1979 Westminster | 59.0 | 28.1 | 36.6 | 10.2 | 12.2 | 19.9 | - | 8.2 | 11.8 | - | 2.1 |
1979 European | 59.0 | 31.3 | 21.9 | 29.8 | 7.3 | 24.6 | - | 6.7 | 6.8 | - | 2.9 |
1981 Local government | 57.3 | 22.8 | 26.5 | 26.6 | 4.2 | 17.5 | - | 5.3 | 8.9 | 1.8 | 8.2 |
1982 Assembly | 59.4 | 28.9 | 29.7 | 23.0 | 6.7 | 18.8 | 10.1 | - | 9.3 | 2.7 | 0.7 |
1983 Westminster | 57.0 | 31.3 | 34.0 | 20.0 | 3.0 | 17.9 | 13.4 | - | 8.0 | 1.9 | 1.6 |
1984 European | 58.0 | 35.4 | 21.5 | 33.6 | 2.9 | 22.1 | 13.3 | - | 5.0 | 1.3 | 0.3 |
1985 Local government | 56.9 | 32.0 | 29.5 | 24.3 | 3.1 | 17.8 | 11.8 | 2.4 | 7.1 | 1.6 | 1.8 |
1986 Westminster by-elections | 71.5 | 18.7 | 51.7 | 14.6 | 5.2 | 12.1 | 6.6 | - | 5.5 | 3.1 | 1.2 |
1987 Westminster | 54.9 | 32.5 | 37.8 | 11.7 | 5.4 | 21.1 | 11.4 | - | 10.0 | 2.6 | - |
1989 Local government | 54.9 | 32.5 | 31.4 | 17.8 | 5.7 | 21.2 | 11.3 | - | 6.8 | 2.1 | 3.7 |
1989 European | 56.2 | 34.7 | 21.5 | 29.9 | 4.8 | 25.5 | 9.2 | - | 5.2 | 1.1 | 2.8 |
1992 Westminster | 55.8 | 33.5 | 34.5 | 13.1 | 8.2 | 23.5 | 10.0 | - | 8.7 | - | 2.0 |
1993 Local government | 50.8 | 34.6 | 29.0 | 17.2 | 4.6 | 21.9 | 12.5 | 0.2 | 7.7 | 1.0 | 5.9 |
1994 European | 54.0 | 38.8 | 23.8 | 29.2 | 1.0 | 28.9 | 9.9 | - | 4.1 | 0.5 | 2.6 |
1996 Forum | 52.9 | 36.9 | 24.2 | 18.8 | 9.9 | 21.4 | 15.5 | - | 6.5 | 2.5 | 1.2 |
1997 Westminster | 50.5 | 40.2 | 32.7 | 13.6 | 4.2 | 24.1 | 16.1 | - | 8.0 | 0.7 | 0.3 |
1997 Local government | 47.5 | 37.6 | 27.8 | 15.6 | 4.1 | 20.7 | 16.9 | - | 6.5 | - | 8.4 |
1998 Assembly | 47.4 | 39.6 | 21.3 | 18.0 | 8.1 | 21.9 | 17.7 | - | 6.5 | 2.0 | 4.5 |
1999 European | 52.2 | 45.5 | 17.6 | 28.3 | 6.3 | 28.1 | 17.4 | - | 2.1 | - | 0.2 |
2001 Westminster | 52.7 | 42.7 | 26.8 | 22.5 | 3.4 | 21.0 | 21.7 | - | 3.6 | 1.0 | - |
2001 Local Government | 47.0 | 40.1 | 22.9 | 21.4 | 2.7 | 19.4 | 20.7 | - | 5.1 | 0.6 | 7.1 |
2003 Assembly | 51.7 | 40.7 | 22.7 | 25.7 | 3.3 | 17.0 | 23.5 | 0.2 | 3.7 | 1.0 | 2.9 |
2004 European | 48.6 | 42.2 | 16.6 | 32.0 | - | 15.9 | 26.3 | - | - | - | 9.2 |
2005 Westminster | 51.8 | 41.8 | 17.7 | 33.7 | 0.4 | 17.5 | 24.3 | - | 3.9 | 0.2 | 2.2 |
2005 Local Government | 48.8 | 40.7 | 18.0 | 29.6 | 1.2 | 17.4 | 23.3 | - | 5.0 | 0.2 | 5.4 |
2007 Assembly | 47.74 | 42.56 | 14.94 | 30.09 | 2.71 | 15.22 | 26.16 | 1.18 | 5.24 | 2.91 | 1.56 |
2009 European | 49.00 | 42.24 | 17.11 | 18.23 | 13.66 | 16.20 | 26.04 | - | 5.51 | - | 3.25 |
2010 Westminster | 50.60 | 41.98 | 15.19 | 24.96 | 10.45 | 16.47 | 25.52 | - | 6.35 | 0..44 | 0.63 |
2011 Local Government | 45.34 | 40.58 | 15.23 | 27.16 | 2.95 | 15.04 | 24.78 | 0.76 | 7.40 | 0.12 | 6.56 |
2011 Assembly | 47.46 | 41.97 | 13.48 | 30.57 | 3.41 | 14.52 | 27.45 | - | 7.84 | 0.18 | 2.55 |
2014 Local Government | - | - | 16.15 | 23.09 | 8.02 | 13.58 | 24.07 | 6.65 | 0.16 | 8.28 | |
2014 European | 50.32 | 38.55 | 13.33 | 20.95 | 16.04 | 13.03 | 25.52 | - | 7.10 | - | 4.04 |
46.52% | 38.44% | 16.01 | 25.66 | 4.85 | 13.90 | 24.54 | - | 8.57 | 0.38 | 6.09 | |
|
|
| UUP | DUP | Other U. | SDLP | SF | Other N. | APNI | Other Non |
|
Election | Total Unionist | Total Nationalist | Unionist bloc | Nationalist bloc | Non confessional | Other | |||||
See also:
Chart based on the above table
Notes:
UUP - Ulster Unionist Party
DUP - Democratic Unionist Party
Other U. - Other Unionist
SDLP - Social Democratic and Labour Party
SF - Sinn Féin
Other N. - Other Nationalist
APNI - Aliance Party of Northern Ireland
Other Non - Other Non-confessional parties
Other - Other parties and independent candidates
The table was initially based on: McGarry, J. and O'Leary, B. (eds) (1990) The Future of Northern Ireland. Oxford: Claredon Press.
The results of the most recent elections are based on media reports. All these figures should be treated as provisional.
The most meaningful comparisons are those between similar types of elections, for example when comparing Westminster elections.
The 1986 Westminster by-elections were held in protest against the Anglo-Irish Agreement. 15 seats were contested and one of the Unionist seats was lost to the SDLP.
CAIN contains information and source material on the conflict and politics in Northern Ireland.
CAIN is based within Ulster University.